Is it possible to get the same service quality while paying less, this is what we’ll see in this comparison guide between Supermetrics and 5 of its less expensive competitors!
Comparative summary
- Who are the competitors in the starting blocks?
- Price
- Reputation and trust
- Data quality by a standard connector
- Dashboard loading speed
- Client service quality
Foreword: this article isn’t sponsored by anyone. I really want to give you my unbiased opinion on Supermetrics alternatives for data studio.
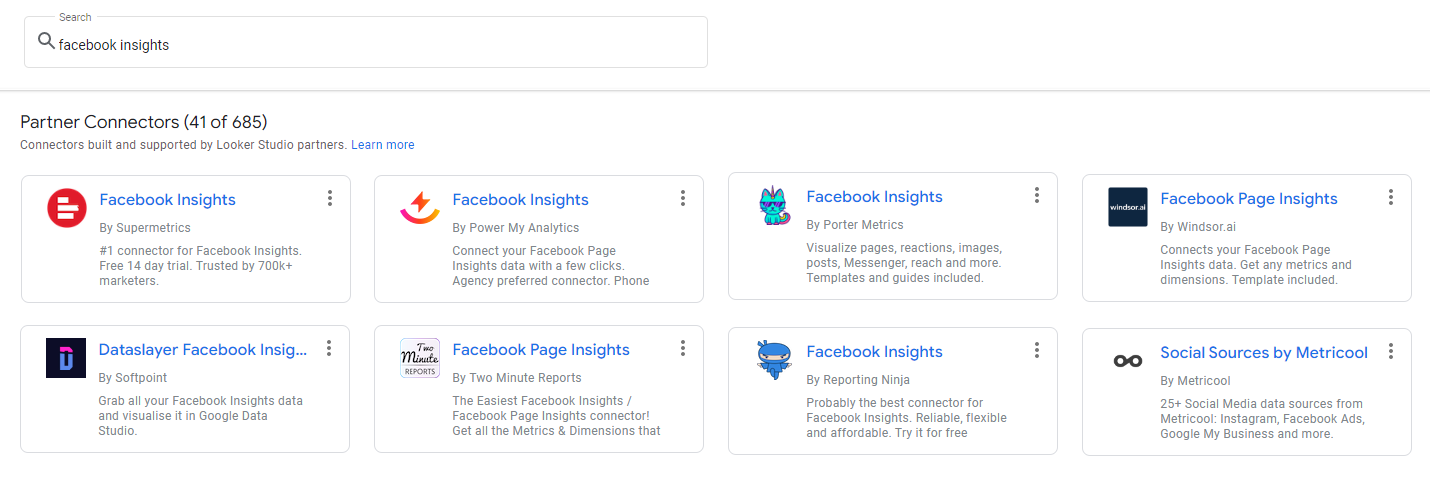
1. Who are the competitors in the starting blocks?
These are our 5 competitors:


I’ve looked at 2 criteria to select them:
- Price, it needs to be less expensive than Supermetrics.
- Number of connectors available, its gets interesting if they have more than a dozen.
We’ll compare them with a connector they all have in common: the Facebook insights connector for data studio, the one that allows you to get all your Facebook pages data onto your dashboards.
Why comparing them with the Facebook Insights connector?
- Because it’s popular!
- Because I know it quite well in its Supermetrics version. The behavior of some metrics can be counter-intuitive, and I’ll take this opportunity to see how the other connectors handle them.
2. Price
Monthly price (€ VAT free) and score
1 x  |
5 x |
1 x |
15 x |
20 x 15 connectors |
score | |
| Supermetrics | 39 | 39 | 199 | 398 (2×199) | 398 (2×199) | ⭐ |
| PMA | 11.55 | 57.75 (5×11.55) | 57.75 (5×11.55) | 75 | 75 | ⭐⭐⭐⭐ |
| Dataslayer | 82 | 82 | 82 | 82 | 82 | ⭐⭐⭐ |
| Windsor | 19 | 19 | 38 (2×19) | 38 (2×19) | 95 (5×19) | ⭐⭐⭐⭐ |
| Porter Metrics | 11.24 | 30 | 30 | 75 | 75 | ⭐⭐⭐⭐⭐ |
| Two Minute Reports | 7.2 | 36 (7.2×5) | 36 (7.2×5) | 72 (2×36) | 75 | ⭐⭐⭐⭐⭐ |
Prices often change, click on the table links to check their current pricing. Feel free to flag in the comments if prices are different!
Pricing models can be very different from one solution to the other. Some can be expensive if you only use 1 connector, but cheap if you have a bunch. I’ve measured the pricing with 5 scenarios, from 1 connector for a single facebook account, to 15 connectors each containing 20 accounts.
We have two winner here, Two Minute Reports. They are the less expensive ones, no matter what. But the others aren’t that bad either compared to Supermetrics, especially when you have to use many connectors.
Anyhow, I’m begging you, don’t just look at the prices before deciding, there’s a lot of other important criteria you should also consider.
3. Reputation and trust
When you don’t know a brand, you need to be reassured of its legitimacy. That’s why I went looking for information to find out how trustworthy each company is.
Supermetrics vs competitors: comparison table – reputation and trust
| capterra score |
creation date |
nb of users |
nb of |
score | |
| Supermetrics | 4.4 | 2013 | 500k | 129 | ⭐⭐⭐⭐⭐ |
| PMA | 4.7 | 2011 | ? | 44 | ⭐⭐⭐⭐ |
| Dataslayer | 4.9 | 2020 | 8000 | 32 | ⭐⭐⭐ |
| Windsor | 4.9 | 2017 | ? | 73 | ⭐⭐⭐⭐ |
| Porter Metrics | 4.5 | 2019 | 5000 | 19 | ⭐⭐⭐ |
| Two Minute Reports | 4.7 | 2020 | 4000 | 29 | ⭐⭐⭐ |
- Capterra score left by users: Well, all 6 have very good scores, which doesn’t really help me differentiate them, but at least, this is reassuring.
- Creation date and number of users:The oldest it is, the better. Same for the number of users, the more the merrier. About this, Supermetrics is far beyond the rest of the troup, according to the numbers they accepted to give me! The most recent ones, such as Porter Metrics or Two Minute Reports still need to prove themselves, that’s why they’re more affordable. The risk is easier to accept this way.
- Number of connectors: Since the price depends on the number of connectors you use, better is to go with a company that offers a lot of them, and you won’t have to go look elsewhere for a missing connector. Once again, don’t just look at how many connectors are available. Above all, make sure those you need are there! All links are in the above table.
4. Data quality by a standard connector
“Are those connectors able to give me the insights I need?”
This is the most important question you should ask yourself. And to answer it, I got my hands dirty.
This is the dashboard I designed for my Facebook page with all insights I needed. I’ve made it with Supermetrics. More details on how I made it in my Data Studio training (in French but easy to follow!).
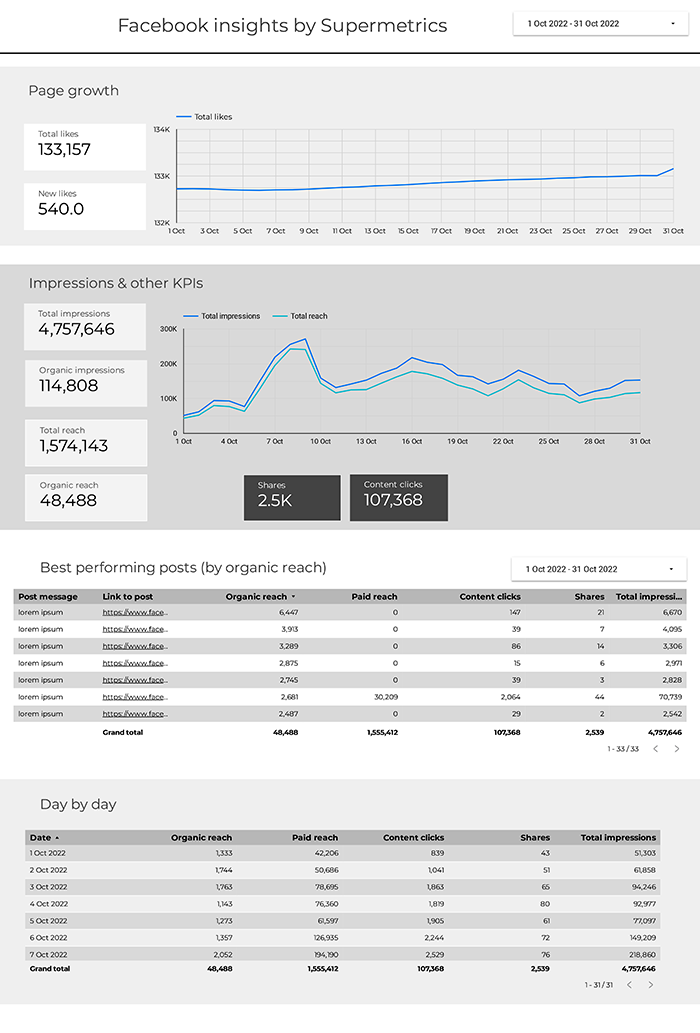
Then, I created 5 copies of this dashboard that I connected to our 5 competitors. And I struggled more or less to get the same data.
2 concrete examples to understand why the Facebook connector can be such a pain!
- Calculating the number of impressions
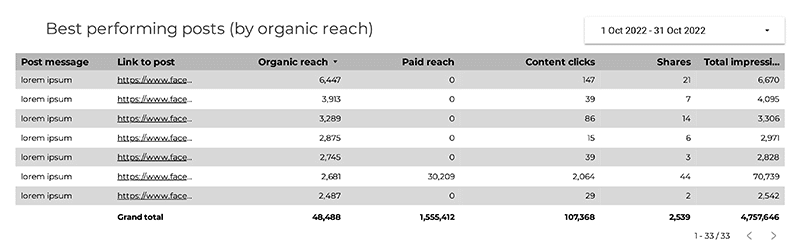
On this table, the impressions aren’t connected to the period I’m picking here, it’s just the number of post impressions from its publication date to today. They call this “lifetime impressions”.

This value is different from the one we see in the table’s recap line, or in a scorecard, that depends on the period selected.
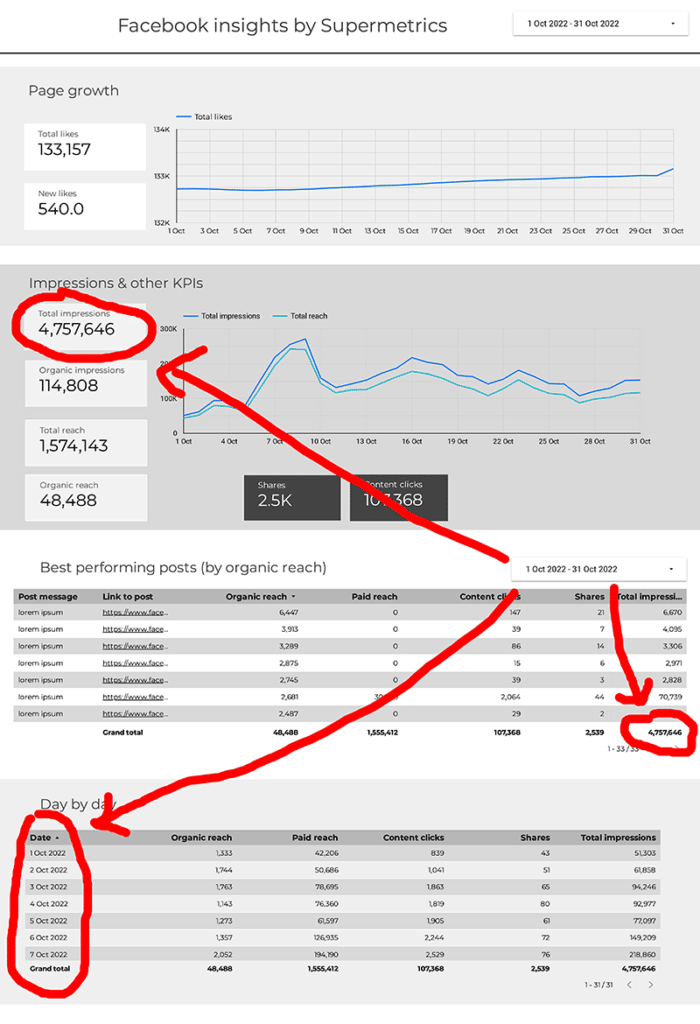
This value of 4 757 646 is the sum of all impressions from all days in October, no matter when posts were made. Same for shares and clicks.
- Calculating the reach
Reach (organic ou paid) works likr impressions on this table. This is the post reach since its creation date to today, regardless if the selected period…
But in a scorecard, or in a table’s recap line with posts as dimension, this isn’t the sum of each post’s reach, nor the sum of each day’s reach, it’s yet more complicated…
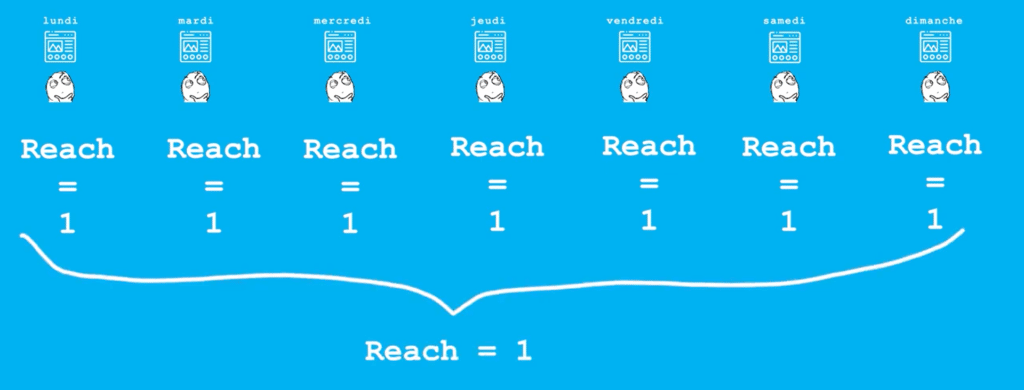
Imagine one visitor, he comes and see your posts during 7 days in a row. If you look at the reach on a daily period, you’d see a reach of 1 during those 7 days. But if you look at the reach over the 7 days period, you’d also have a reach of 1 because it’s the same user we touched on those 7 days. The reach doesn’t add up day by day, you have to look at it over predefined periods of time. And Facebook’s API only gives it over periods of 1, 7 or 28 days.
But then what happens when you select one full month? Well, Supermetrics is slightly cheating. The reach is in fact the one of the 28 last days of the month, which explains why you don’t see the same value as the one on Facebook’s insights, which is the correct one.
Pretty tough no? Now let’s see how Supermetrics’s competitors calculate all of that!
How does PMA calculate metrics?
The reach (organic, paid or total) gives me broken scorecards and tables when the period is different then 1, 7 or 28 days. PMA doesn’t cheat like Supermetrics, but it’s still a bit annoying to get a broken table because of that. Therefore, we need to set the period to 28 days to properly compare it with Supermetrics, and then, all metrics are aligned.
Impressions are automatically translated into the matching metric, called views. Same goes for likes and clicks, but my shares are measured differently. Here, shares are measured as the sum of each post’s share, not as the sum of all days’s share.
Aright, now the posts’s table… It took me a while to get it back on track because the indicators didn’t find their match, but this remains doable.
The dates’s table, the share metric is unfortunately not compatible with dates, so it’s impossible to get the number of shares by day with PMA. That’s a shame, but overall, it’s doing quite well.
PMA score for metrics quality: ⭐⭐⭐⭐
How does Dataslayer calculate metrics?
New likes gives me the last day’s value, not the value of the full period, same for my scorecards with the reach and impressions, although it works well on graphs.
About shares, the same thing happens as on PMA, we get the sum of posts’s shares and not the sum of each day’s share. Clicks are slightly different, I don’t really know why.
For the post’s table, I got no trouble, everything automatically translated, and also, the recap line is correct, contrary to Supermetrics, very good point here.
For the dates’s table, nothing to do either, but once again, the metrics we see come from the posts made during the period, contrary to Supermetrics who shows the metrics of all posts during this period.
Dataslayer score for metrics quality: ⭐⭐⭐⭐
How does Windsor calculate metrics?
The likes scorecard sums up all day’s likes! However, the scorecard of new likes works well, so does the graph, but the 1st day is missing, go figure why!
About impressions and reach, this is a misery! I have an indicator called page impressions unique, which vaguely resembles the total impressions and reach, but impossible to get the others. Shares are missing.
As for my 2 tables, same struggle, no metrics are comparable! Shares and reach are missing, I consistently get an error when I try to put the post impressions on the first table, in short, that’s bad.
Windsor score for metrics quality: ⭐
This bad score doesn’t mean that all of Windsor’s connectors are bad, up to you to test them on other connectors and get your own opinion.
How does Porter Metrics calculate metrics?
The scorecard of organic impressions gives me the last value and not the sum.
About the shares, the same thing happens as with PMA, it’s the sum of each post’s shares, not the sum of each days’s share. Same for clicks.
No problem for the posts table, but impossible to get the shares and clicks on the dates table.
Porter Metrics score for metrics quality: ⭐⭐⭐⭐
How does Two Minute Reports calculate metrics?
Unfortunately, I couldn’t get the total likes as a scorecard.
The reach gives me the sum of each day’s reach, yikes. And shares are missing
On my tables, no post clicks but a “post link click” that I can add up to “post other clicks” to get back to what Supermetrics proposes. The rest is ok. Overall, this is decent.
2 Minute Reports score for metrics quality: ⭐⭐⭐
5. Dashboard loading speed
Let’s move on to something very important but quite often neglected: your dashboard loading speed!
You can have one killer dashboard, if it takes 1 minute to load, no one will use it!
That’s why I started my timer and made 2 tests:
- 1st test: the dashboard is already open, and I change the period to select the month of August. How long does the dashboard take to update?
- 2nd test: I’m opening my dashboard in a private window, how long does it take to load?
Comparison table of dashboards loading speed (secondes)
| 1st test | 2nd test | score | |
| Supermetrics | 12 | 13 | ⭐⭐⭐⭐ |
| PMA | 6 | 10 | ⭐⭐⭐⭐⭐ |
| Dataslayer | 39 | 21 | ⭐ |
| Windsor | 44 | 9 | ⭐⭐ |
| Porter Metrics | 15 | 15 | ⭐⭐⭐ |
| Two Minute Reports | 36 | 12 | ⭐⭐ |
The first test results vary a lot, from 6 seconds for our Usain Bolt Power My Analytics to 44 seconds for Windsor. But on the 2nd test, some of the previous bad students are doing much better!
6. Client service quality
You don’t need it if all goes well, but this can become really problematic if you face an issue. This is why I asked 2 questions to our competitors, the 1st one was the same for all.
- I have a table with all my posts made in September, showing their number of impressions. I had made a pdf export of my dashboard last week. I made another one this week. I see that the value of impressions are slightly above the previous ones, even though I selected the same period, September, why is that? (Remember, this is what I explained a few minutes ago, impressions are lifetime values, they depend on the date you look at the dashboard, not the period of time you select.)
- How are you calculating the reach and why am I seeing something different on my Facebook’s insights?
I didn’t send screenshots, I didn’t want to make their job too easy… I wanted to see if some of them were able to give me the reason straight away, or if I was going to need several back and forthes.
Results:
Supermetrics & PMA: ⭐⭐⭐⭐
I didn’t get my answers straight away, which is why I’m not giving them 5 stars, but good answers were fast to come, without too many back and forthes.
Dataslayer, Porter Metrics & Two Minute Reports: ⭐⭐
I got someone to answer me quite fast, but this was tedious to get the correct answers. And in the end, for those 3, I only managed to get 1 correct answer. It was quite frustrating, long (like 5 or 6 back and forths to get to the beginning of an answer (I had to send them back my questions several times…)
Windsor: ⭐ (and yet I’m generous)
My questions were left in a limbo for 1 week before I went back to them. I got someone over their chat, that answered at random, without really proposing to investigate further.
With my 2 questions, I understood something.Your questions never directly reach the most qualified technicians. There is always a filter by another person in order to avoid overloading technicians with basic questions.
My 2 questions were pretty specific, so they could have been directly forwarded to technicians, but it wasn’t the case. Each company got back to me at least once, asking for screenshots or dashboard access, before sharing my question with those most likely to have the answer. I guess this is part of their standard procedure
Final recap table
| price | reputation | quality | speed | client service |
final score |
|
| Supermetrics | ⭐ | ⭐⭐⭐⭐⭐ | ⭐⭐⭐⭐⭐ | ⭐⭐⭐⭐ | ⭐⭐⭐⭐ | ⭐⭐⭐⭐ |
| PMA | ⭐⭐⭐⭐ | ⭐⭐⭐⭐ | ⭐⭐⭐⭐ | ⭐⭐⭐⭐⭐ | ⭐⭐⭐⭐ | ⭐⭐⭐⭐ |
| Dataslayer | ⭐⭐⭐ | ⭐⭐⭐ | ⭐⭐⭐⭐ | ⭐ | ⭐⭐ | ⭐⭐⭐ |
| Windsor | ⭐⭐⭐⭐ | ⭐⭐⭐⭐ | ⭐ | ⭐⭐ | ⭐ | ⭐⭐ |
| Porter Metrics | ⭐⭐⭐⭐⭐ | ⭐⭐⭐ | ⭐⭐⭐⭐ | ⭐⭐⭐ | ⭐⭐ | ⭐⭐⭐ |
| Two Minute Reports | ⭐⭐⭐⭐⭐ | ⭐⭐⭐ | ⭐⭐⭐ | ⭐⭐ | ⭐⭐ | ⭐⭐⭐ |
In my opinion,one competitor is doing way better than the others : PMA. It’s the only one who does the job as well as Supermetrics while being less expensive. If you want to save some money without compromising the rest, PMA seems to be the right choice.
Now if your budget is very tight and you’re ready for some compromises on the speed or the client service, you might want to try Two Minute Reports.
And finally, if money is no worry and you want to take 0 risk, well then, stay with Supermetrics! You’ll pay more, but you’ll be in the leader’s very safe hands.
No matter your budget, please do your own tests before committing. All links are in the above table and each connector proposes a 14 days free trial, so go for it!